NCI Cancer Atlas
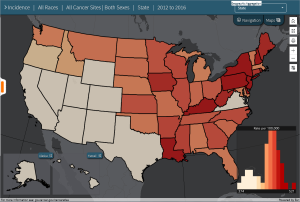
This application is an interactive digital atlas that enables users to generate geographic maps of cancer rates, risk factors for cancer, screening statistics, and other geographical data related to cancer. The system offers free data download for research purposes.
With the NCI Cancer Atlas you can:
- Select the type of Statistic and By-Variables shown on the map with a simple menu based control.

- Change the group colors of mapped statistics by choosing from a variety of color ramp options on the right of the map.
- Extract the map by printing or saving an image or downloading the statistics in a delimited format for further analyses in other software.
For more information on NCI Cancer Atlas controls and features read our Introduction page.
The NCI Cancer Atlas provides access to the following statistics:
- SEER Cancer Incidence Age-Adjusted Rates and Late State Age-Adjusted Incidence Rates for 2017 to 2021 for the entire United States for available state registries by:
- State
- Health Service Area
- County
- US Mortality Age-Adjusted Rates for 2018 to 2022 for the entire United States by:
- State
- State Economic Area
- Health Service Area
- County
- Five or Ten Year Historical Mortality Age-Adjusted Rates from 1970 to 2019 for the entire United States by:
- State
- State Economic Area
- Health Service Area
- County
- Demographics from the American Community Survey for 2019 to 2023 by:
- State Geography
- State Economic Area
- Health Service Area
- County Geography
- Screening and Risk Factors from the BRFSS for 2021, 2022, or 2023 by:
- State
Table View
The Cancer Atlas map is not accessible to users of assistive technologies, however all statistics displayed in the application are available as data tables in an accessible table view. This page can also produce CSV file downloads of any selected data.
If the statistics that you are interested in are not available in this tool, SEER provides cancer statistics in a variety of formats. See Statistical Summaries, Interactive Tools and Publications for more options.